

The diagram shows a sketch of a curve with equation y = f(x). The points A(1, 0),
Question:
The diagram shows a sketch of a curve with equation y = f(x).
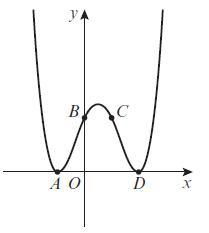
The points A(−1, 0), B(0, 2), C(1, 2) and D(2, 0) lie on the curve. Sketch the following graphs and give the coordinates of the points A, B, C and D after each transformation:
a. y + 2 = f(x)
b. 1/2 y = f(x)
c. y − 3 = f(x)
d. 3y = f(x)
e. 2y − 1 = f(x)
Fantastic news! We've Found the answer you've been seeking!
Step by Step Answer:
Certainly lets analyze each of the transformations given and how they affect the coordinates of points A B C and D on the curve a y 2 fx This transfor...View the full answer

Answered By
Muhammad Umair
I have done job as Embedded System Engineer for just four months but after it i have decided to open my own lab and to work on projects that i can launch my own product in market. I work on different softwares like Proteus, Mikroc to program Embedded Systems. My basic work is on Embedded Systems. I have skills in Autocad, Proteus, C++, C programming and i love to share these skills to other to enhance my knowledge too.
1+ Reviews
10+ Question Solved
Related Book For 

Edexcel AS And A Level Mathematics Pure Mathematics Year 1/AS
ISBN: 9781292183398
1st Edition
Authors: Greg Attwood
Question Posted:
