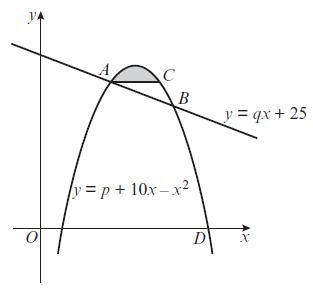
The diagram shows part of the curve with equation y = p + 10x x 2
Question:
The diagram shows part of the curve with equation y = p + 10x − x2, where p is a constant, and part of the line l with equation y = qx + 25, where q is a constant. The line l cuts the curve at the points A and B. The x-coordinates of A and B are 4 and 8 respectively. The line through A parallel to the x-axis intersects the curve again at the point C.
a. Show that p = −7 and calculate the value of q.
b. Calculate the coordinates of C.
c. The shaded region in the diagram is bounded by the curve and the line segment AC. Using integration and showing all your working, calculate the area of the shaded region.

Fantastic news! We've Found the answer you've been seeking!
Step by Step Answer:
Related Book For 

Edexcel AS And A Level Mathematics Pure Mathematics Year 1/AS
ISBN: 9781292183398
1st Edition
Authors: Greg Attwood
Question Posted:


