

The scatter graph shows the height, h cm, and inseam leg measurement, l cm, of six adults.
Question:
The scatter graph shows the height, h cm, and inseam leg measurement, l cm, of six adults. A line of best fit has been added to the scatter graph.
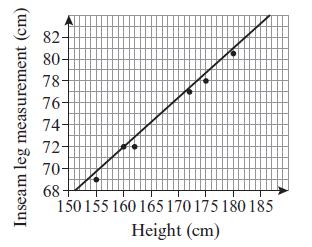
a. Use two points on the scatter graph to calculate the gradient of the line.
b. Use your answer to part a to write a linear model relating height and inseam in the form l = kh, where k is a constant to be found.
c. Comment on the validity of your model for small values of h.
Fantastic news! We've Found the answer you've been seeking!
Step by Step Answer:
a To find the gradient of the line consider 2 points that lie on the line or lie neares...View the full answer

Answered By
Utsab mitra
I have the expertise to deliver these subjects to college and higher-level students. The services would involve only solving assignments, homework help, and others.
I have experience in delivering these subjects for the last 6 years on a freelancing basis in different companies around the globe. I am CMA certified and CGMA UK. I have professional experience of 18 years in the industry involved in the manufacturing company and IT implementation experience of over 12 years.
I have delivered this help to students effortlessly, which is essential to give the students a good grade in their studies.
2+ Reviews
10+ Question Solved
Related Book For 

Edexcel AS And A Level Mathematics Pure Mathematics Year 1/AS
ISBN: 9781292183398
1st Edition
Authors: Greg Attwood
Question Posted:
