

The sketch shows the graphs of the curves with equations:y = 2 5x x 2
Question:
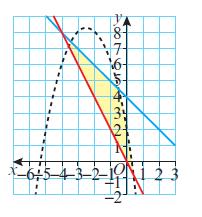
The sketch shows the graphs of the curves with equations:y = 2 – 5x – x2, 2x + y = 0 and x + y = 4.
Write down the set of inequalities that represent the shaded region shown in the sketch.
Fantastic news! We've Found the answer you've been seeking!
Step by Step Answer:
To determine the set of inequalities that represent the shaded region in the sketch lets analyze the ...View the full answer

Answered By
Churchil Mino
I have been a tutor for 2 years and have experience working with students of all ages and abilities. I am comfortable working with students one-on-one or in small groups, and am able to adapt my teaching style to meet the needs of each individual. I am patient and supportive, and my goal is to help my students succeed.
I have a strong background in math and science, and have tutored students in these subjects at all levels, from elementary school to college. I have also helped students prepare for standardized tests such as the SAT and ACT. In addition to academic tutoring, I have also worked as a swim coach and a camp counselor, and have experience working with children with special needs.
0 Reviews
10+ Question Solved
Related Book For 

Edexcel AS And A Level Mathematics Pure Mathematics Year 1/AS
ISBN: 9781292183398
1st Edition
Authors: Greg Attwood
Question Posted:
