

The table below shows the population of Angola between 1970 and 2010. This data can be modelled
Question:
The table below shows the population of Angola between 1970 and 2010.
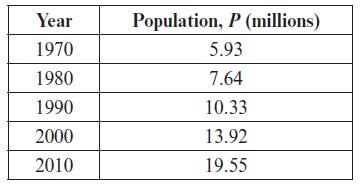
This data can be modelled using an exponential function of the form P = abt, where t is the time in years since 1970 and a and b are constants.
a. Copy and complete the table below, giving your answers to 2 decimal places.
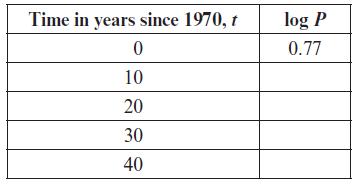
b. Plot a graph of log P against t using the values from your table and draw in a line of best fit.
c. By rearranging P = abt, explain how the graph you have just drawn supports the assumed model.
d. Use your graph to estimate the values of a and b to two significant figures.
Fantastic news! We've Found the answer you've been seeking!
Step by Step Answer:
a To complete the table we need to calculate the values of time in years t and the logarithm of the ...View the full answer

Answered By
CHARLES ODIONYI
I am a post graduate in Economics. Economics is my favorite subject. I was the best outgoing student of my UG and PG batches.I have qualified UGC NET in economics during the year 2018. I worked ad guest lecturer in Economics in Assumption College, Kottayam and SB College, Kottayam. also worked as Economics mentor for preparing aspirants to qualify NET in Economics. I am always curious to prepared self notes in Economics. I completed an internship in Kerala State Planning Board. Also did ASPIRE internship by Government of Kerala.
0 Reviews
10+ Question Solved
Related Book For 

Edexcel AS And A Level Mathematics Pure Mathematics Year 1/AS
ISBN: 9781292183398
1st Edition
Authors: Greg Attwood
Question Posted:
