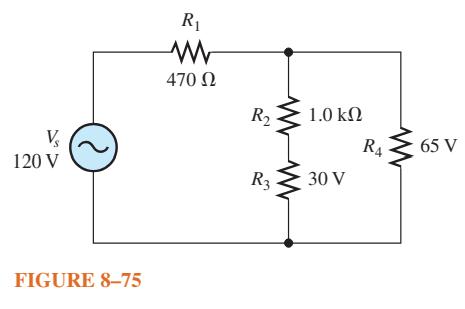
Find the half-cycle average values of the voltages across R 1 and R 2 in Figure 875.
Question:
Find the half-cycle average values of the voltages across R1 and R2 in Figure 8–75. All values shown are rms.
Transcribed Image Text:
V₂ 120 V FIGURE 8-75 R₁ 470 02 R₂ R3 1.0 ΚΩ 30 V R4 65 V
Fantastic news! We've Found the answer you've been seeking!
Step by Step Answer:
Answer rating: 75% (4 reviews)
To find the halfcycle average values of the voltages across R1 and R2 in Figure 875 we need to apply ...View the full answer
Answered By
User l_917591
As a Business Management graduate from Moi University, I had the opportunity to work as a tutor for undergraduate students in the same field. This experience allowed me to apply the theoretical knowledge I had gained in a practical setting, while also honing my teaching and communication skills.
As a tutor, I was responsible for conducting tutorial sessions, grading assignments and exams, and providing feedback and support to my students. I also assisted with the preparation of course materials and collaborated with other tutors and professors to ensure consistency in teaching and assessment.
0.00
0 Reviews
10+ Question Solved
Related Book For
Question Posted:
Students also viewed these Engineering questions
-
The accompanying table can be used to make paired comparisons of the desirability of salary, deferred compensation, and pensions as a function of a = current and future employer marginal tax rates, b...
-
The Lennard-Jones Potential A commonly used potential energy function for the interaction of two molecules (see Fig. 18.8) is the Lennard-Jones 6-12 potential Where, is the distance between the...
-
The diagram shows a simplified household circuit. Resistor R1 = 240.0 Ω represents a light bulb; resistor R2 = 12.0Ω represents a hair dryer. The resistors r =...
-
Ritz-Carlton. The name alone evokes images of luxury and quality. As the first hotel company to win the Malcolm Baldrige National Quality Award, the Ritz treats quality as if it is the heartbeat of...
-
Transaction analysis-quantitative; analyze results. Stacy-Ann Kelly owns and operates Kelly's Furniture Emporium, Inc. The balance sheet totals for assets, liabilities, and stockholder's equity at...
-
Sanders agreed in writing to write, direct, and produce a motion picture on the subject of lithography (a method for printing using stone or metal) for the Tamarind Lithography Workshop. After the...
-
What are the functions of bone marrow?
-
The monthly demand for the latest computer at Newland Computers follows a normal distribution with a mean of 350 and standard deviation of 75. Newland purchases these computers for $1,200 and sells...
-
Consider the following information about a photography business Leila opened last year: Price = $70 per unit Quantity sold = 12,500 Implicit cost = $95,000 Average material cost = $55 per unit...
-
Determine the rms voltage across R 3 in Figure 876. 30 V (peak) R 1.0 W 16 V (peak-to-peak) FIGURE 8-76 R4 560 R 5 V (rms) R3 ww
-
A sinusoidal voltage is applied to the resistive circuit in Figure 874. Determine the following: (a) I rms (b) I avg (c) I p (d) I pp (e) I at the positive peak. 10 V FIGURE 8-74 R 1.0
-
Refer to Data Set 9 in Appendix B for these two data sets: pulse rates of those who smoke and pulse rates of those who don't smoke. Construct a box plot for each data set. Based on the results, do...
-
If the firms in a competitive industry are earning profits, in the long run new firms will ________. But if most fi rms are losing money, then in the long run some of the firms will __________.
-
When market price is above equilibrium price, the market price will be driven ______. a) up by unhappy buyers b) up by unhappy sellers c) down by unhappy buyers d) down by unhappy sellers
-
When output is zero , fixed cost is and variable cost is _______. a) zero , zero b) zero, more than zero c) more than zero, zero d) more than zero, more than zero.
-
The perfect competitor operates at the ____________ point of her average total cost curve in the long run.
-
A decrease in supply can be brought about by _________. a) a price increase b) a price decrease c) a random event like a hurricane or an earthquake d) a change in consumers tastes or preferences
-
a. If s21 represents the larger of two sample variances, can the F test statistic ever be less than 1? b. Can the F test statistic ever be a negative number? c. If testing the claim that 21 22 what...
-
What is the difference between direct materials and indirect materials?
-
Estimate the friction angle of the soil C in Problem 2.7 (see Figure P2.7) at 80% relative density and void ratio of 0.61 using the empirical correlations given by a. Eq. (2.87) b. Eq. (2.88) Figure...
-
A Shelby tube has outside diameter of 76.2 mm and wall thickness of 1.651 mm. What is the area ratio of the tube?
-
A thin-walled sampling tube must be fabricated to obtain good-quality undisturbed clay samples of 75 mm diameter. What is the maximum possible wall thickness?
-
Assume that there are 2 investors with superior stock-picking ability and they are both tracking the same passive portfolio. Also, assume that they have the same forecast for the passive portfolio's...
-
Ethereum (one of the largest altcoins) had its Initial Coin Offering (ICO) on July 30, 2015. Ether tokens were sold during this ICO at 31 per token. On January 13, 2018, the price of one Ether token...
-
Calculate the following financial ratios and enter them into the table below. Return on Assets = Net Income / Total Assets Return on Equity = Net Income / Equity Debt-to-equity Ratio = Total...
Study smarter with the SolutionInn App