

Without performing any calculations, determine which measure of central tendency best represents the graphed data. Explain your
Question:
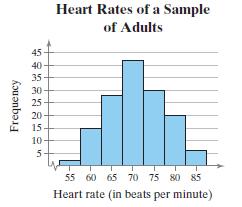
Without performing any calculations, determine which measure of central tendency best represents the graphed data. Explain your reasoning.
Fantastic news! We've Found the answer you've been seeking!
Step by Step Answer:
sice data is quantitative and skewed to ...View the full answer

Answered By
Carlos otieno
I am readily available to provide correct answers to students on time.
0 Reviews
10+ Question Solved
Related Book For 

Elementary Statistics Picturing The World
ISBN: 9780134683416
7th Edition
Authors: Ron Larson, Betsy Farber
Question Posted:
