

Many times in statistics it is necessary to see if a set of data values is approximately
Question:
Many times in statistics it is necessary to see if a set of data values is approximately normally distributed. There are special techniques that can be used. One technique is to draw a histogram for the data and see if it is approximately bell-shaped. (Note; It does not have to be exactly symmetric to be bell-shaped.)
The numbers of branches of the 50 top banks are shown.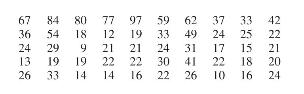
1. Construct a frequency distribution for the data.
2. Construct a histogram for the data.
3. Describe the shape of the histogram.
4. Based on your answer, do you feel that the distribution is approximately normal?
In addition to the histogram, distributions that are approximately normal have about \(68 \%\) of the values fall within 1 standard deviation of the mean, about \(95 \%\) of the data values fall within 2 standard deviations of the mean, and almost \(100 \%\) of the data values fall within 3 standard deviations of the mean.
5. Find the mean and standard deviation for the data.
6. What percent of the data values fall within 1 standard deviation of the mean?
7. What percent of the data values fall within 2 standard deviations of the mean?
8. What percent of the data values fall within 3 standard deviations of the mean?
9. How do your answers to questions 6,7 , and 8 compare to 68,95 , and \(100 \%\), respectively?
10. Does your answer help support the conclusion you reached? Explain.
Step by Step Answer:
1 One possible frequency distribution is the following 2 according to the freque...View the full answer


Elementary Statistics A Step By Step Approach
ISBN: 9781260360653
11th Edition
Authors: Allan Bluman
