

The data in Table 2.9 is due to Anscombe (1973). The purpose of this exercise is to
Question:
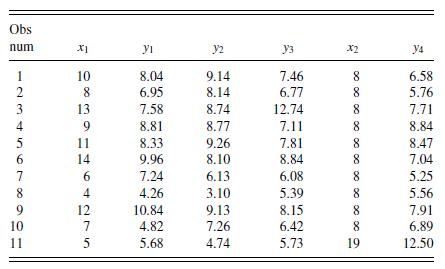
The data in Table 2.9 is due to Anscombe (1973). The purpose of this exercise is to demonstrate how plotting data can reveal important information that is not evident in numerical summary statistics.
a. Compute the averages and standard deviations of each column of data. Check that the averages and standard deviations of each of the \(x\) columns are the same, within two decimal places, and similarly for each of the \(y\) columns.
b. Run four regressions, (i) \(y_{1}\) on \(x_{1}\), (ii) \(y_{2}\) on \(x_{1}\), (iii) \(y_{3}\) on \(x_{1}\), and (iv) \(y_{4}\) on \(x_{2}\). Verify, for each of the four regressions fits, that \(b_{0} \approx 3.0\), \(b_{1} \approx 0.5, s \approx 1.237\), and \(R^{2} \approx 0.677\), within two decimal places.
c. Produce scatter plots for each of the four regression models that you fit in part (b).
d. Discuss the fact that the fitted regression models produced in part (b) imply that the four datasets are similar, though the four scatter plots produced in part (c) yield a dramatically different story.
Step by Step Answer:


Regression Modeling With Actuarial And Financial Applications
ISBN: 9780521135962
1st Edition
Authors: Edward W. Frees
