

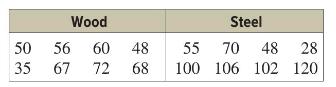
The data shown are the speeds in miles per hour of a sample of wooden roller coasters
Question:
The data shown are the speeds in miles per hour of a sample of wooden roller coasters and a sample of steel roller coasters. Compare the distributions by using boxplots.
Fantastic news! We've Found the answer you've been seeking!
Step by Step Answer:
Step 1 For the wooden coasters Step 2 For the steel coasters Step 3 Draw the boxplots See Fi...View the full answer

Answered By
Charles mwangi
I am a postgraduate in chemistry (Industrial chemistry with management),with writing experience for more than 3 years.I have specialized in content development,questions,term papers and assignments.Majoring in chemistry,information science,management,human resource management,accounting,business law,marketing,psychology,excl expert ,education and engineering.I have tutored in other different platforms where my DNA includes three key aspects i.e,quality papers,timely and free from any academic malpractices.I frequently engage clients in each and every step to ensure quality service delivery.This is to ensure sustainability of the tutoring aspects as well as the credibility of the platform.
2+ Reviews
10+ Question Solved
Related Book For 
Elementary Statistics A Step By Step Approach
ISBN: 9781260360653
11th Edition
Authors: Allan Bluman
Question Posted:
