

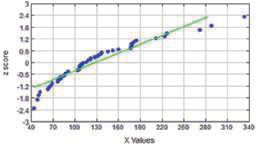
The normal quantile plot represents service times during the dinnerhours at Dunkin? Donuts (from Data Set 25
Question:
The normal quantile plot represents service times during the dinnerhours at Dunkin? Donuts (from Data Set 25 ?Fast Food? in Appendix ?B).
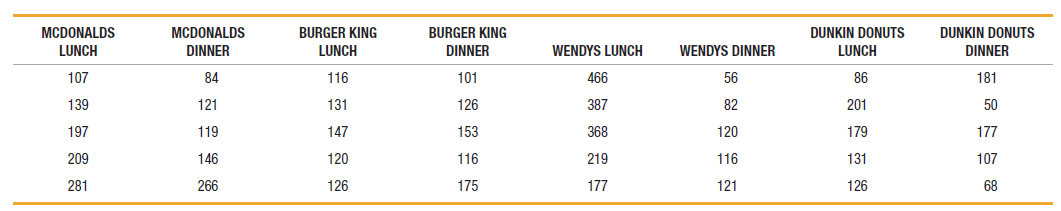
Data set 25
Fantastic news! We've Found the answer you've been seeking!
Step by Step Answer:
Not normal the points are no...View the full answer

Answered By
SK ABDUL RAJA
I am a part-time tutor at a coaching center. I have been teaching from last year. My main motives are to assisted students in acquiring a better understanding of targeted weak areas within a subject or a subject as a whole. Prepared weekly lesson plans to help students prepare for their courses. Implemented and ran activities for a group of children. Generate discussion questions to stimulate topic conversations between students. Analyzed and maintained records of student's progress to teaching individual needs.
0 Reviews
10+ Question Solved
Related Book For 
Question Posted:
