

In Example 4, you used 10 pairs of data to find (r approx 0.874). Test the significance
Question:
In Example 4, you used 10 pairs of data to find \(r \approx 0.874\). Test the significance of this correlation coefficient. Use \(\alpha=0.05\).
Data from Example 4
Calculate the correlation coefficient for the gross domestic products and carbon dioxide emissions data in Example 1. Interpret the result in the context of the data.
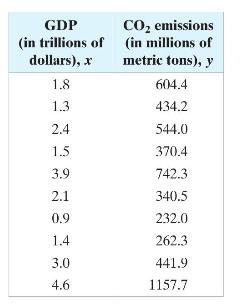
Data from Example 1
An economist wants to determine whether there is a linear relationship between a country's gross domestic product (GDP) and carbon dioxide \(\left(\mathrm{CO}_{2}\right)\) emissions. The data are shown in the table at the left. Display the data in a scatter plot and describe the type of correlation.
Fantastic news! We've Found the answer you've been seeking!
Step by Step Answer:

Answered By
Surojit Das
I have vast knowledge in the field of Mathematics, Business Management and Marketing. Besides, I have been teaching on the topics Management leadership, Business Administration, Human Resource Management, Business Communication, Accounting, Auditing, Organizer Behaviours, Business Writing, Essay Writing, Copy Writing, Blog Writing since 2020. It is my personality to act quickly in any emergency situations when students need my services. I am very professional and serious in every questions students asked me at the time of dealing any projects. I have been serving detailed, quality, properly analysed research paper through the years.
91+ Reviews
278+ Question Solved
Related Book For 

Elementary Statistics Picturing The World
ISBN: 9781292260464
7th Global Edition
Authors: Betsy Farber, Ron Larson
Question Posted:
