

P 45 Use the Standard Normal Table or technology to find the z-score that corresponds to the
Question:
P45
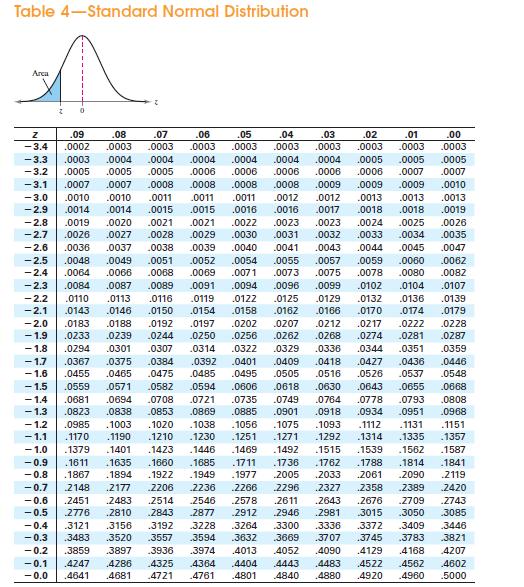
Use the Standard Normal Table or technology to find the z-score that corresponds to the cumulative area or percentile.
Fantastic news! We've Found the answer you've been seeking!
Step by Step Answer:

Answered By
Zablon Gicharu
I am an educator who possesses the requisite skills and knowledge due to interacting with students for an extended period. I provide solutions to various problems in step-by-step explanations, a well-thought approach and an understandable breakdown. My goal is to impart more straightforward methodologies and understanding to students for more remarkable achievements.
4+ Reviews
10+ Question Solved
Related Book For 

Elementary Statistics Picturing The World
ISBN: 9781292260464
7th Global Edition
Authors: Betsy Farber, Ron Larson
Question Posted:
