

The contingency table shows the results of a random sample of 2197 adults classified by their favorite
Question:
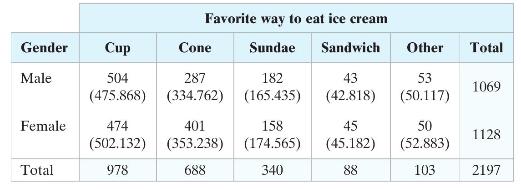
The contingency table shows the results of a random sample of 2197 adults classified by their favorite way to eat ice cream and gender. The expected frequencies are displayed in parentheses. At \(\alpha=0.01\), can you conclude that the variables favorite way to eat ice cream and gender are related?
Fantastic news! We've Found the answer you've been seeking!
Step by Step Answer:
The expected frequencies were calculated because ea...View the full answer

Answered By
Muhammad Umair
I have done job as Embedded System Engineer for just four months but after it i have decided to open my own lab and to work on projects that i can launch my own product in market. I work on different softwares like Proteus, Mikroc to program Embedded Systems. My basic work is on Embedded Systems. I have skills in Autocad, Proteus, C++, C programming and i love to share these skills to other to enhance my knowledge too.
1+ Reviews
10+ Question Solved
Related Book For 

Elementary Statistics Picturing The World
ISBN: 9781292260464
7th Global Edition
Authors: Betsy Farber, Ron Larson
Question Posted:
