

The data set represents the numbers of minutes a sample of 27 people exercise each week. (a)
Question:
The data set represents the numbers of minutes a sample of 27 people exercise each week.
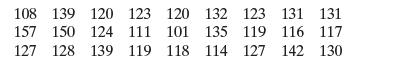
(a) Construct a frequency distribution for the data set using five classes. Include class limits, midpoints, boundaries, frequencies, relative frequencies, and cumulative frequencies.
(b) Display the data using a frequency histogram and a frequency polygon on the same axes.
(c) Display the data using a relative frequency histogram.
(d) Describe the shape of the distribution as symmetric, uniform, skewed left, skewed right, or none of these.
(e) Display the data using an ogive.
(f) Display the data using a stem-and-leaf plot. Use one line per stem.
(g) Display the data using a box-and-whisker plot.
Step by Step Answer:


Elementary Statistics Picturing The World
ISBN: 9781292260464
7th Global Edition
Authors: Betsy Farber, Ron Larson
