

The estimated percent distribution of the U.S. population for 2025 is shown in the pie chart. Find
Question:
The estimated percent distribution of the U.S. population for 2025 is shown in the pie chart. Find the probability of each event.
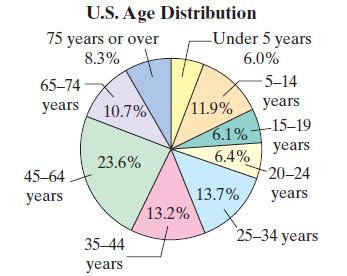
(a) Randomly selecting someone who is under 5 years old
(b) Randomly selecting someone who is 45 years or over
(c) Randomly selecting someone who is not 65 years or over
(d) Randomly selecting someone who is between 20 and 34 years old
Fantastic news! We've Found the answer you've been seeking!
Step by Step Answer:
a 006...View the full answer

Answered By
PALASH JHANWAR
I am a Chartered Accountant with AIR 45 in CA - IPCC. I am a Merit Holder ( B.Com ). The following is my educational details.
PLEASE ACCESS MY RESUME FROM THE FOLLOWING LINK: https://drive.google.com/file/d/1hYR1uch-ff6MRC_cDB07K6VqY9kQ3SFL/view?usp=sharing
3+ Reviews
10+ Question Solved
Related Book For 

Elementary Statistics Picturing The World
ISBN: 9781292260464
7th Global Edition
Authors: Betsy Farber, Ron Larson
Question Posted:
