

The figure at the right shows the mean distances traveled by drivers each day. You randomly select
Question:
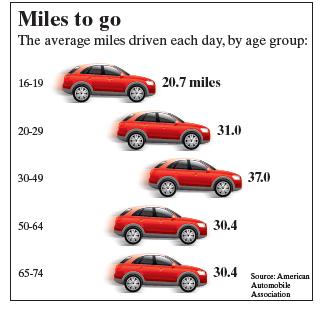
The figure at the right shows the mean distances traveled by drivers each day. You randomly select 50 drivers ages 16 to 19. What is the probability that the mean distance traveled each day is between 19.4 and 22.5 miles?
Assume σ = 6.5 miles.
Fantastic news! We've Found the answer you've been seeking!
Step by Step Answer:
The sample size is greater than 30 so ...View the full answer

Answered By
Vivek Kumar
Currently I am pursuing my B. tech degree and working part time in Chegg as question answer expert.
I have a experience of 1 year working as subject matter expert in Chegg and Hello Experts. My main objective is to solve problem in easiest way so that anyone can understand the solution.
0 Reviews
10+ Question Solved
Related Book For 

Elementary Statistics Picturing The World
ISBN: 9781292260464
7th Global Edition
Authors: Betsy Farber, Ron Larson
Question Posted:
