

The table shows the quantity of wheat (in millions of kilograms per year) produced by India and
Question:
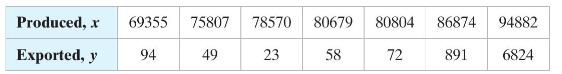
The table shows the quantity of wheat (in millions of kilograms per year) produced by India and the quantity of wheat (in millions of kilograms per year) exported by India for seven years. The equation of the regression line is \(\hat{y}=0.249 x-19023\).
Use the data to
(a) find the coefficient of determination \(r^{2}\) and interpret the result, and
(b) find the standard error of estimate \(s_{e}\) and interpret the result.
Fantastic news! We've Found the answer you've been seeking!
Step by Step Answer:
a 0642 About 642 of the variation in the quantity of wheat exported can be ...View the full answer

Answered By
Parvesh Kumar
I am an experienced Mathematics and Statistics tutor with 10 years of experience teaching students and working professionals. I love teaching students who are passionate to learn subjects or wants to understand any mathematics and statistics concept at graduation or master’s level. I have worked with thousands of students in my teaching career. I have helped students deal with difficult topics and subjects like Calculus, Algebra, Discrete Mathematics, Complex analysis, Graph theory, Hypothesis testing, Probability, Statistical Inference and more. After learning from me, students have found Mathematics and Statistics not dull but a fun subject. I can handle almost all curriculum of mathematics. I did B.Sc (mathematics), M.Sc (mathematics), M.Tech (IT) and am also Gate (CS) qualified. I have worked in various college and school and also provided online tutoring to American and Canadian students. I look forward to discussing with you and make learning a meaningful and purposeful
4+ Reviews
10+ Question Solved
Related Book For 

Elementary Statistics Picturing The World
ISBN: 9781292260464
7th Global Edition
Authors: Betsy Farber, Ron Larson
Question Posted:
