

Use a scatter plot to display the data shown in the table at the left. The data
Question:
Use a scatter plot to display the data shown in the table at the left. The data represent the numbers of coaching hours and the hourly fees (in dollars) of 12 cricket coaches.
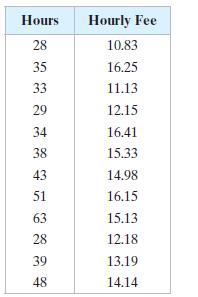
Organize the data using the indicated type of graph. Describe any patterns.
Fantastic news! We've Found the answer you've been seeking!
Step by Step Answer:
It appears that t...View the full answer

Answered By
Cristine kanyaa
I possess exceptional research and essay writing skills. I have successfully completed over 5000 projects and the responses are positively overwhelming . I have experience in handling Coursework, Session Long Papers, Manuscripts, Term papers, & Presentations among others. I have access to both physical and online library. this makes me a suitable candidate to tutor clients as I have adequate materials to carry out intensive research.
1538+ Reviews
3254+ Question Solved
Related Book For 

Elementary Statistics Picturing The World
ISBN: 9781292260464
7th Global Edition
Authors: Betsy Farber, Ron Larson
Question Posted:
