

Examine the run chart from a process of filling 12-oz cans of cola and do the following:
Question:
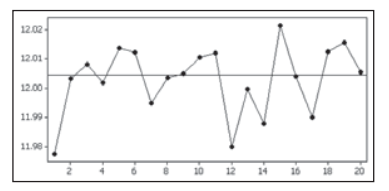
Examine the run chart from a process of filling 12-oz cans of cola and do the following: (a) Determine whether the process is within statistical control; (b) if the process is not within statistical control, identify reasons why it is not; (c) apart from being within statistical control, does the process appear to be behaving as it should?
Fantastic news! We've Found the answer you've been seeking!
Step by Step Answer:
a The process is not within statistical control b The run chart shows that there are several points ...View the full answer

Answered By
SHINKI JALHOTRA
I have worked with other sites like Course Hero as a tutor and I have great knowledge on IT skills.
0 Reviews
10+ Question Solved
Related Book For 

Question Posted:
