

In Exercise 18, use technology to perform the hypothesis test with a P-value. Compare your result with
Question:
In Exercise 18, use technology to perform the hypothesis test with a P-value. Compare your result with the result obtained using rejection regions. Are they the same?
Data from Exercise 18:
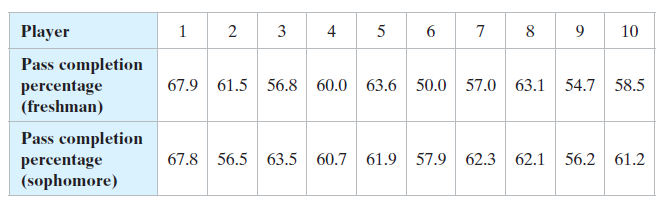
The pass completion percentages of 10 college football quarterbacks for their freshman and sophomore seasons are shown in the table below. At α = 0.10, is there enough evidence to support the claim that the pass completion percentages have changed?
Fantastic news! We've Found the answer you've been seeking!
Step by Step Answer:
Yes P 02...View the full answer

Answered By
Nazrin Ziad
I am a post graduate in Zoology with specialization in Entomology.I also have a Bachelor degree in Education.I posess more than 10 years of teaching as well as tutoring experience.I have done a project on histopathological analysis on alcohol treated liver of Albino Mice.
I can deal with every field under Biology from basic to advanced level.I can also guide you for your project works related to biological subjects other than tutoring.You can also seek my help for cracking competitive exams with biology as one of the subjects.
2+ Reviews
10+ Question Solved
Related Book For 

Elementary Statistics Picturing The World
ISBN: 9780134683416
7th Edition
Authors: Ron Larson, Betsy Farber
Question Posted:
