

Let each subgroup consist of the 10 values within a decade. Construct an chart and determine whether
Question:
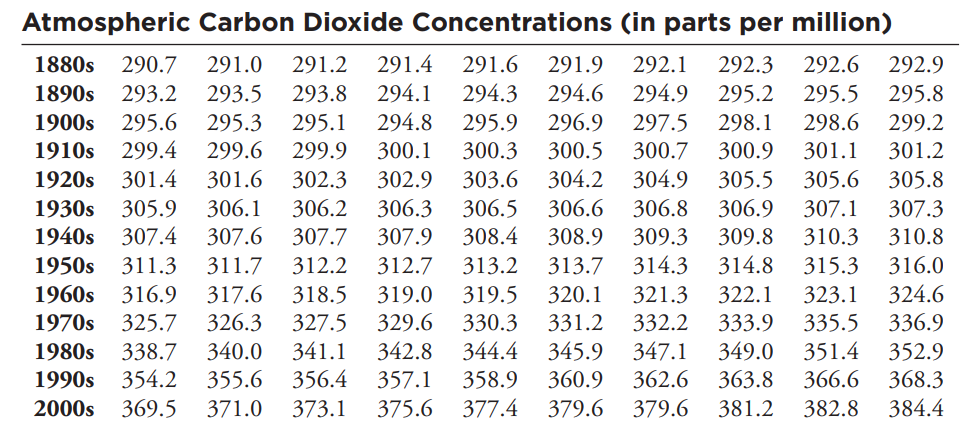
Let each subgroup consist of the 10 values within a decade. Construct an chart and determine whether the process mean is within statistical control. If it is not, identify which of the three out-of-control criteria lead to rejection of a statistically stable mean.
Use the data in the following table, which lists carbon dioxide concentrations (in parts per million) for each year from 1880 to 2009, with projected values used for the last four years. Atmospheric carbon dioxide is believed to be the result of human activity and a major contributor to the greenhouse effect that is at least partly responsible for global warming.
Fantastic news! We've Found the answer you've been seeking!
Step by Step Answer:
To determine if the process mean is within statistical control we need to perform control chart anal...View the full answer

Answered By
Dulal Roy
As a tutor, I have gained extensive hands-on experience working with students one-on-one and in small group settings. I have developed the ability to effectively assess my students' strengths and weaknesses, and to customize my teaching approach to meet their individual needs.
I am proficient at breaking down complex concepts into simpler, more digestible pieces, and at using a variety of teaching methods (such as visual aids, examples, and interactive exercises) to engage my students and help them understand and retain the material.
I have also gained a lot of experience in providing feedback and guidance to my students, helping them to develop their problem-solving skills and to become more independent learners. Overall, my hands-on experience as a tutor has given me a deep understanding of how to effectively support and encourage students in their learning journey.
0 Reviews
10+ Question Solved
Related Book For 

Question Posted:
