

Refer to the data set in Exercise 26 and the box-and-whisker plot you drew that represents the
Question:
Refer to the data set in Exercise 26 and the box-and-whisker plot you drew that represents the data set.
(a) About 50% of the employees made less than what amount per hour?
(b) What percent of the employees made more than $23.39 per hour?
(c) What percent of the employees made between $23.39 and $38.24
per hour?
(d) You randomly select one employee from the sample. What is the likelihood that the employee made more than $30.87 per hour? Write your answer as a percent.
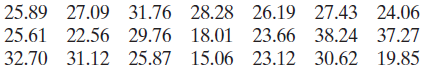
Data from exercise 26:
The hourly earnings (in dollars) of a sample of 21 employees at a consulting firm
Fantastic news! We've Found the answer you've been seeking!
Step by Step Answer:
a 2619 per...View the full answer

Answered By
Mugdha Sisodiya
My self Mugdha Sisodiya from Chhattisgarh India. I have completed my Bachelors degree in 2015 and My Master in Commerce degree in 2016. I am having expertise in Management, Cost and Finance Accounts. Further I have completed my Chartered Accountant and working as a Professional.
Since 2012 I am providing home tutions.
2+ Reviews
10+ Question Solved
Related Book For 

Elementary Statistics Picturing The World
ISBN: 9780134683416
7th Edition
Authors: Ron Larson, Betsy Farber
Question Posted:
