

Refer to the two STATDISK-generated boxplots shown below that are drawn on the same scale. One boxplot
Question:
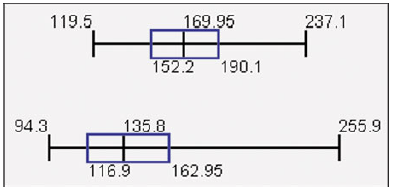
Refer to the two STATDISK-generated boxplots shown below that are drawn on the same scale. One boxplot represents weights of randomly selected men and the other represents weights of randomly selected women. Which boxplot represents women? How do you know? Which boxplot depicts weights with more variation?
Fantastic news! We've Found the answer you've been seeking!
Step by Step Answer:
Consider the diagram given below Consider the two STATDISKgenerated randomly selected Boxplot as ...View the full answer

Answered By
Shaira grace
I have experience of more than ten years in handing academic tasks and assisting students to handle academic challenges. My level of education and expertise allows me communicate eloquently with clients and therefore understanding their nature and solving it successfully.
4+ Reviews
10+ Question Solved
Related Book For 

Question Posted:
