

Shown below are an chart (top) and an R chart (bottom) obtained using the monthly elevations of
Question:
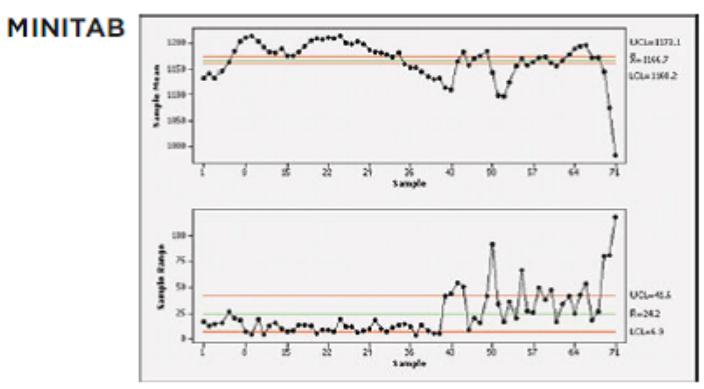
Shown below are an chart (top) and an R chart (bottom) obtained using the monthly elevations of Lake Mead at Hoover Dam (based on data from the U.S. Department of the Interior). The elevations are in feet above sea level. The control charts are based on the 12 monthly elevations for each of the 71 consecutive and recent years available as of this writing. What do the control charts tell us about Lake Mead?
Fantastic news! We've Found the answer you've been seeking!
Step by Step Answer:
The control charts indicate that the elev ations of Lake Mead ...View the full answer

Answered By
SHINKI JALHOTRA
I have worked with other sites like Course Hero as a tutor and I have great knowledge on IT skills.
0 Reviews
10+ Question Solved
Related Book For 

Question Posted:
