

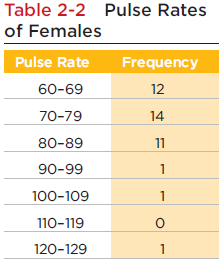
Table 2-2 is a frequency distribution summarizing the pulse rates of females (listed in Table 2-1), and
Question:
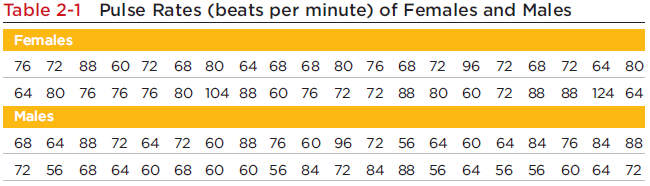
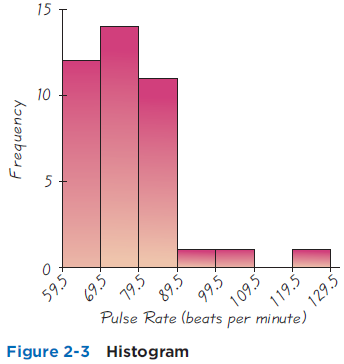
Table 2-2 is a frequency distribution summarizing the pulse rates of females (listed in Table 2-1), and Figure 2-3 is a histogram representing those same pulse rates. When investigating the distribution of that data set, which is more effective: the frequency distribution or the histogram? Why?
The word "distribution" has several meanings in the financial world, most of them pertaining to the payment of assets from a fund, account, or individual security to an investor or beneficiary. Retirement account distributions are among the most...
Fantastic news! We've Found the answer you've been seeking!
Step by Step Answer:
YesThe graph is mislea...View the full answer

Answered By
Utsab mitra
I have the expertise to deliver these subjects to college and higher-level students. The services would involve only solving assignments, homework help, and others.
I have experience in delivering these subjects for the last 6 years on a freelancing basis in different companies around the globe. I am CMA certified and CGMA UK. I have professional experience of 18 years in the industry involved in the manufacturing company and IT implementation experience of over 12 years.
I have delivered this help to students effortlessly, which is essential to give the students a good grade in their studies.
2+ Reviews
10+ Question Solved
Related Book For 

Question Posted:
