

The following table lists the marriage and divorce rates per 1000 people in the United States for
Question:
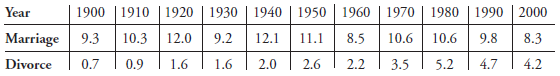
The following table lists the marriage and divorce rates per 1000 people in the United States for selected years since 1900 (based on data from the Department of Health and Human Services). Construct a multiple bar graph of the data. Why do these data consist of marriage and divorce rates rather than total numbers of marriages and divorces? Comment on any trends that you observe in these rates, and give explanations for these trends.
Fantastic news! We've Found the answer you've been seeking!
Step by Step Answer:
The multiple bar chart showing the marriage and divorce rates per 1000 people in the United States for selected years The two categories namely marriage and divorce are displayed in sidebyside bar chart Total numbers in both categories have increased due to increasing population so the marriage and divorce rates give better information about trends The marriage rate has remained somewhat steady but the divorce rate ...View the full answer

Answered By
Bhartendu Goyal
Professional, Experienced, and Expert tutor who will provide speedy and to-the-point solutions. I have been teaching students for 5 years now in different subjects and it's truly been one of the most rewarding experiences of my life. I have also done one-to-one tutoring with 100+ students and help them achieve great subject knowledge. I have expertise in computer subjects like C++, C, Java, and Python programming and other computer Science related fields. Many of my student's parents message me that your lessons improved their children's grades and this is the best only thing you want as a tea...
2+ Reviews
10+ Question Solved
Related Book For 

Question Posted:
