

The table shows the results of a survey in which 250 male and 250 female workers ages
Question:
The table shows the results of a survey in which 250 male and 250 female workers ages 25 to 64 were asked if they contribute to a retirement savings plan at work.
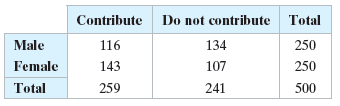
(a) Find the probability that a randomly selected worker contributes to a retirement savings plan at work, given that the worker is male.
(b) Find the probability that a randomly selected worker is female, given that the worker contributes to a retirement savings plan at work.
Use the table to find each conditional probability.
Fantastic news! We've Found the answer you've been seeking!
Step by Step Answer:
M worker is male R w...View the full answer

Answered By
Branice Buyengo Ajevi
I have been teaching for the last 5 years which has strengthened my interaction with students of different level.
1+ Reviews
10+ Question Solved
Related Book For 

Elementary Statistics Picturing The World
ISBN: 9780134683416
7th Edition
Authors: Ron Larson, Betsy Farber
Question Posted:
