

The table shows the salaries (in thousands of dollars) for a sample of individuals from the federal,
Question:
The table shows the salaries (in thousands of dollars) for a sample of individuals from the federal, state, and local levels of government. At α = 0.01, can you conclude that at least one mean salary is different from the others?
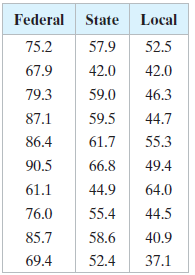
(a) Identify the claim and state H0 and Ha,
(b) Find the critical value and identify the rejection region,
(c) Find the test statistic F,
(d) Decide whether to reject or fail to reject the null hypothesis, and
(e) Interpret the decision in the context of the original claim. Assume the samples are random and independent, the populations are normally distributed, and the population variances are equal.
Fantastic news! We've Found the answer you've been seeking!
Step by Step Answer:
a The claim is that at least one ...View the full answer

Answered By
Shivani Dubey
Hello guys, I am very good with the Advance mathematics, Calculus, Number theory, Algebra, Linear algebra, statistics and almost all topics of mathematics. I used to give individual tutoring students in offline mode but now want to help students worldwide so I am joining here. I can also give solutions in various coding languages of mathematics and software like mathematica, R, Latex, Matlab, Statistica, etc.
feel free to ask any doubt regarding mathematics
2+ Reviews
10+ Question Solved
Related Book For 

Elementary Statistics Picturing The World
ISBN: 9780134683416
7th Edition
Authors: Ron Larson, Betsy Farber
Question Posted:
