Use a time series chart to display the data shown in the table. The data represent the
Question:
Use a time series chart to display the data shown in the table. The data represent the percentages of the U.S. gross domestic product (GDP) that come from the construction sector.
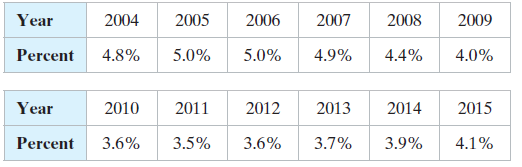
Organize the data using the indicated type of graph. Describe any patterns.
Transcribed Image Text:
Year 2005 2007 2009 2004 2006 2008 Percent 4.0% 4.8% 5.0% 5.0% 4.9% 4.4% Year 2010 2011 2012 2013 2014 2015 3.5% Percent 4.1% 3.6% 3.6% 3.7% 3.9%
Fantastic news! We've Found the answer you've been seeking!
Step by Step Answer:
Answer rating: 71% (7 reviews)
Let the horizontal axis represent the years and let the vertical axis re...View the full answer
Answered By
Somshukla Chakraborty
I have a teaching experience of more than 4 years by now in diverse subjects like History,Geography,Political Science,Sociology,Business Enterprise,Economics,Environmental Management etc.I teach students from classes 9-12 and undergraduate students.I boards I handle are IB,IGCSE, state boards,ICSE, CBSE.I am passionate about teaching.Full satisfaction of the students is my main goal.
I have completed my graduation and master's in history from Jadavpur University Kolkata,India in 2012 and I have completed my B.Ed from the same University in 2013. I have taught in a reputed school of Kolkata (subjects-History,Geography,Civics,Political Science) from 2014-2016.I worked as a guest lecturer of history in a college of Kolkata for 2 years teaching students of 1st ,2nd and 3rd year. I taught Ancient and Modern Indian history there.I have taught in another school in Mohali,Punjab teaching students from classes 9-12.Presently I am working as an online tutor with concept tutors,Bangalore,India(Carve Niche Pvt.Ltd.) for the last 1year and also have been appointed as an online history tutor by Course Hero(California,U.S) and Vidyalai.com(Chennai,India).
4.00+
2+ Reviews
10+ Question Solved
Related Book For
Elementary Statistics Picturing The World
ISBN: 9780134683416
7th Edition
Authors: Ron Larson, Betsy Farber
Question Posted:
Students also viewed these Mathematics questions
-
Use a stem-and-leaf plot to display the data shown in the table at the left. The data represent the prices (in cents per pound) paid to 28 farmers for apples. Organize the data using the indicated...
-
Use a scatter plot to display the data shown in the table at the left. The data represent the numbers of hours worked and the hourly wages (in dollars) of 12 production workers. Hours...
-
A company has the data shown in the table from the sale of its product. If x represents hundreds of units and revenue R is in hundreds of dollars, approximate the total revenue from the sale of 1000...
-
Given a shaky economy and high heating costs, more and more households are struggling to pay utility bills (The Wall Street Journal, February, 14, 2008). Particularly hard hit are households with...
-
Let Yt be an MA(2) process, Yt = + t + 1t + 2t-2. Find formulas for the autocovariance and autocorrelation functions of Yt.
-
Below is data from the Lazy R Ranch on its production and price of meats and poultry. For the years 2014 1nd 2015. a. Compute the price relatives for each type of meat and poultry. b. Computed a...
-
Which of the following is not an element of an internal control system? a. Auditing b. The control environment C. Monitoring d. Information and communication
-
Linda Olsen is studying for the next accounting midterm examination. Summarize for Linda what she should know about management functions.
-
Describe in plain words, with a few sentences, what an economic bubble looks like. Use an example, other than the one given in the video, to describe the bubble. List the 5 stages that economists use...
-
Determine the smallest allowable cross-sectional areas of members BD, BE, and CE of the truss shown. The working stresses are 20000 psi in tension and 12000 psi in compression. (A reduced stress in...
-
Use a time series chart to display the data shown in the table. The data represent the numbers of bachelors degrees in engineering (in thousands) conferred in the U.S. Organize the data using the...
-
Display the data below in a stem-and-leaf plot. Describe the differences in how the dot plot and the stem-and-leaf plot show patterns in the data. Heights of Players on a College Basketball Team 72...
-
From the Treasury strip yield curve, the current required yields on one- and two-year Treasuries are i1 = 4.65 percent and i2 = 5.50 percent, respectively. Further, the current yield curve indicates...
-
Franks wants a system of forecasting that will provide as accurate a picture as possible of first year sales in order to satisfy demands from head office who are sponsoring the launch of Pizza...
-
Describe the reviewing and editing process for the audit report.
-
How did the audit function evolve in the UK?
-
Pages immediate task is to recruit members of the sales team. Advise Page as to the type of salespeople he should be looking for.
-
What options does the internal auditor have in including the auditees views regarding audit findings?
-
Briefly describe how operations has evolved from the Industrial Revolution to the Digital Revolution.
-
The following T-accounts show postings of selected transactions. Indicate the journal used in recording each of these postings a through e. Cash Accounts Receivable Inventory (d) 500 (e) 300 (b)...
-
A sports drink maker claims that the mean calorie content of its beverages is 72 calories per serving. Determine whether the claim represents the null hypothesis or the alternative hypothesis. If a...
-
Why can decreasing the probability of a type I error cause an increase in the probability of a type II error?
-
In Exercises 57, you are given a null hypothesis and three confidence intervals that represent three samplings. Determine whether each confidence interval indicates that you should reject H 0 ....
-
Bill Gate Company incurred costs for materials and conversion in the amount of P 45,000 and P 4,860 respectively. As of the same date, the work in process inventory in units of P 6,000 is 40%...
-
In popular culture, the word "chemical" is often used as shorthand for "dangerous chemical" or "man-made chemical". But labeling a chemical as dangerous is highly subjective and misleading. Few...
-
The NH Jones Manufacturing Company produces porcelain figurines. The molding department inspects damaged units when they are 65% complete. Direct materials are added at the end of the process, and...
Study smarter with the SolutionInn App