

Consider the following relative frequency distribution for the data in Table 2.7, in which the classes have
Question:
Consider the following relative frequency distribution for the data in Table 2.7, in which the classes have differing widths.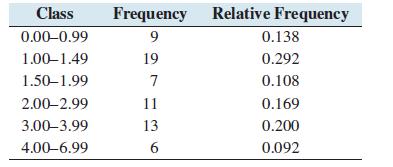
a. Compute the class width for each of the classes.
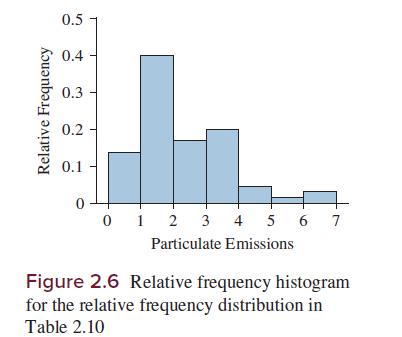
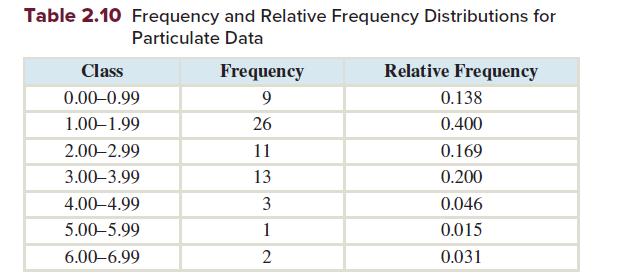
b. Construct a relative frequency histogram. Compare it to the relative frequency histogram in Figure 2.6, in which the classes all have the same width. Explain why using differing widths gives a distorted picture of the data.
c. The density of a class is the relative frequency divided by the class width. For each class, divide the relative frequency by the class width to obtain the density.
d. Construct a histogram in which the height of each rectangle is equal to the density of the class. This is called a density histogram.
e. Compare the density histogram to the relative frequency histogram in Figure 2.6, in which the classes all have the same width. Explain why differing class widths in a density histogram do not distort the data.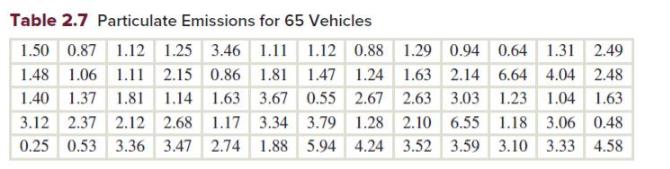
Step by Step Answer:


