

Construct a normal quantile plot for the data in Exercise 23. Explain how the plot shows whether
Question:
Construct a normal quantile plot for the data in Exercise 23.
Explain how the plot shows whether it is appropriate to treat this sample as coming from an approximately normal population.
Exercise 23
The number of defective items produced on an assembly line during an hour is counted for a random sample of 20 hours. The results are as follows.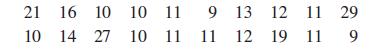
Construct a stem-and-leaf plot for this sample. Is it reasonable to treat the sample as coming from an approximately normal population? Explain.
Step by Step Answer:

This question has not been answered yet.
You can Ask your question!
Related Book For 

Question Posted:
