

Following are observed frequencies. The null hypothesis is H0: p1 = 0.4, p2 = 0.25, p3 =
Question:
Following are observed frequencies. The null hypothesis is H0: p1 = 0.4, p2 = 0.25, p3 = 0.05, p4 = 0.1, p5 = 0.2.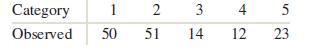
a. Compute the expected frequencies.
b. Compute the value of X2.
c. How many degrees of freedom are there?
d. Test the hypothesis that the distribution of the observed frequencies is as given by the null hypothesis. Use the α = 0.05 level of significance.
Fantastic news! We've Found the answer you've been seeking!
Step by Step Answer:

Answered By
Patrick Busaka
I am a result oriented and motivated person with passion for challenges because they provide me an opportunity to grow professionally.
38+ Reviews
58+ Question Solved
Related Book For 

Question Posted:
