

Following is a pie chart that presents the percentages of video games sold in each of four
Question:
Following is a pie chart that presents the percentages of video games sold in each of four rating categories.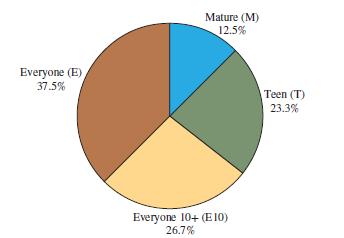
a. Construct a relative frequency bar graph for these data.
b. Construct a relative frequency Pareto chart for these data.
c. In which rating category are the most games sold?
d. True or false: More than twice as many T-rated games are sold as M-rated games.
e. True or false: Fewer than one in five games sold is an M-rated game.
Step by Step Answer:

This question has not been answered yet.
You can Ask your question!
Related Book For 

Question Posted:
