

In each of the following plots, one point is an outlier. The blue solid line is the
Question:
In each of the following plots, one point is an outlier. The blue solid line is the least-squares regression line computed without using the outlier, and the red dashed line is the least-squares regression line computed by including the outlier. State whether the outlier is influential.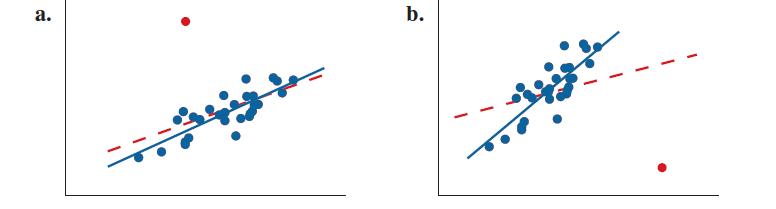
Fantastic news! We've Found the answer you've been seeking!
Step by Step Answer:

Answered By
Charles mwangi
I am a postgraduate in chemistry (Industrial chemistry with management),with writing experience for more than 3 years.I have specialized in content development,questions,term papers and assignments.Majoring in chemistry,information science,management,human resource management,accounting,business law,marketing,psychology,excl expert ,education and engineering.I have tutored in other different platforms where my DNA includes three key aspects i.e,quality papers,timely and free from any academic malpractices.I frequently engage clients in each and every step to ensure quality service delivery.This is to ensure sustainability of the tutoring aspects as well as the credibility of the platform.
2+ Reviews
10+ Question Solved
Related Book For 

Question Posted:
