

Table 3.9 presents the February rainfalls in Los Angeles for the period 19722016. a. Show that the
Question:
Table 3.9 presents the February rainfalls in Los Angeles for the period 1972–2016.
a. Show that the mean of these data is μ = 3.624 and the population standard deviation is σ = 3.410.
b. Show that the z-score for a rainfall of 0 (rounded to two decimal places) is z = −1.06.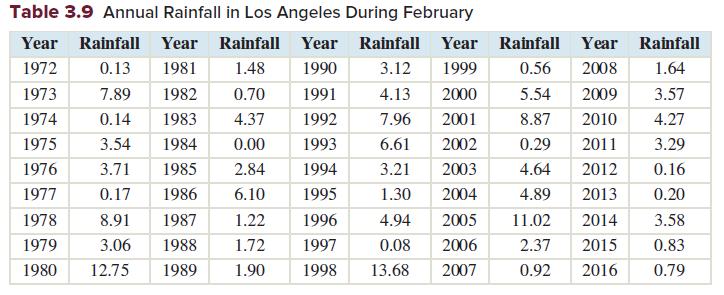
c. Show that the z-score for a rainfall of 7.25 (rounded to two decimal places) is z = 1.06.
d. What percentage of the years had rainfalls of 0?
e. What percentage of the years had rainfalls of 7.25 or more?
f. The z-scores indicate that a rainfall of 0 and a rainfall of 7.25 are about equally extreme. Is a rainfall of 7.25 really as extreme as a rainfall of 0, or is it less extreme?
g. These data are skewed to the right. Explain how skewness causes the z-score to give misleading results.
Step by Step Answer:


