

The following bar graph presents the revenue (in millions of $) for the music industry from music
Question:
The following bar graph presents the revenue (in millions of $) for the music industry from music streaming and music downloading for the years 2010–2015. Does the graph present an accurate picture of the differences in revenue from these two sources? Or is it misleading? Explain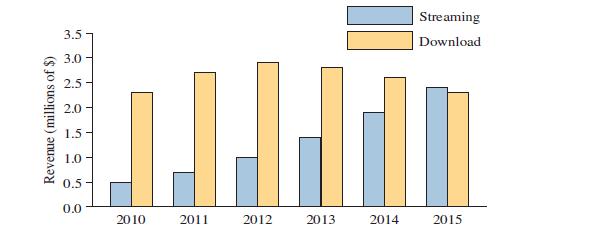
Step by Step Answer:

This question has not been answered yet.
You can Ask your question!
Related Book For 

Question Posted:
