

The following figure is a probability density curve that represents the lifetime, in months, of a certain
Question:
The following figure is a probability density curve that represents the lifetime, in months, of a certain type of laptop battery.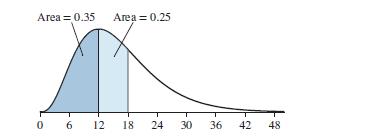
a. Find the proportion of batteries with lifetimes between 12 and 18 months.
b. Find the proportion of batteries with lifetimes less than 18 months.
c. What is the probability that a randomly chosen battery lasts more than 18 months?
Fantastic news! We've Found the answer you've been seeking!
Step by Step Answer:

Answered By
Rajat Gupta
used to take tution classes from my school time.
Conducted special topic claases during my graduation to help the students pass their exams.
Currently, teaching and conducting online claases during my post- graduation too.
1+ Reviews
10+ Question Solved
Related Book For 

Question Posted:
