

The following frequency distribution presents the number of units sold for categories of physical and digital music
Question:
The following frequency distribution presents the number of units sold for categories of physical and digital music in the years 2014 and 2015.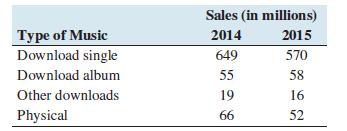
a. Construct a relative frequency distribution for the 2014 sales.
b. Construct a relative frequency distribution for the 2015 sales.
c. Construct a side-by-side relative frequency bar graph to compare the sales in 2014 and 2015.
d. True or False: Sales in every category declined from 2014 to 2015.
Step by Step Answer:

This question has not been answered yet.
You can Ask your question!
Related Book For 

Question Posted:
