

The following table is a life table, reproduced from the chapter introduction. With an understanding of some
Question:
The following table is a life table, reproduced from the chapter introduction. With an understanding of some basic concepts of probability, one can use the life table to compute the probability that a person of a given age will still be alive a given number of years from now. Life insurance companies use this information to determine how much to charge for life insurance policies.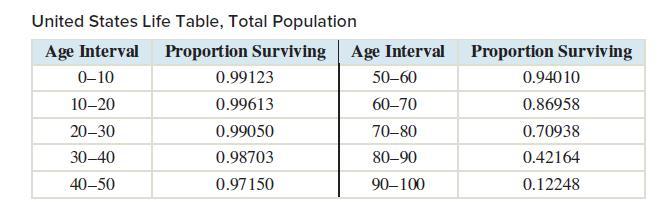
The column labeled ‘‘Proportion Surviving’’ gives the proportion of people alive at the beginning of an age interval who will still be alive at the end of the age interval. For example, among those currently age 20, the proportion who will still be alive at age 30 is 0.99050, or 99.050%. We will begin by computing the probability that a person lives to any of the ages 10, 20, ... , 100.
The first number in the column is the probability that a person lives to age 10. So![]()
The key to using the life table is to realize that the rest of the numbers in the ‘‘Proportion Surviving’’ column are conditional probabilities. They are probabilities that a person is alive at the end of the age interval, given that they were alive at the beginning of the age interval. For example, the row labeled ‘‘20–30’’ contains the conditional probability that someone alive at age 20 will be alive at age 30:![]()
Step by Step Answer:


