

The following table presents the budget (in millions of dollars) for selected organizations that received U.S. government
Question:
The following table presents the budget (in millions of dollars) for selected organizations that received U.S. government funding for arts and culture in both 2006 and 2016.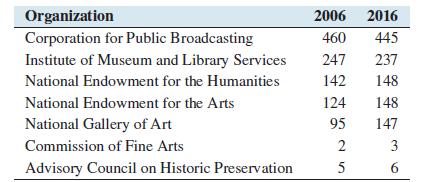
a. Construct a scatterplot of the funding in 2016 (y) versus the funding in 2006 (x).
b. Compute the correlation coefficient between the funding in 2006 and the funding in 2016.
c. For an organization whose funding in 2006 was above the average, would you expect their funding in 2016 to be above or below average? Explain.
d. Which of the following is the best interpretation of the correlation coefficient?
i. If we increase the funding for an organization in 2006, this will cause the funding in 2016 to increase.
ii. If we increase the funding for an organization in 2016, this will cause the funding in 2006 to increase.
iii. Some organizations get more funding than others, and those that were more highly funded in 2006 were generally more highly funded in 2016 as well.
Step by Step Answer:


