

The following table presents the daily high temperatures for the city of Macon, Georgia, in degrees Fahrenheit,
Question:
The following table presents the daily high temperatures for the city of Macon, Georgia, in degrees Fahrenheit, for the winter months of January and February, 2013.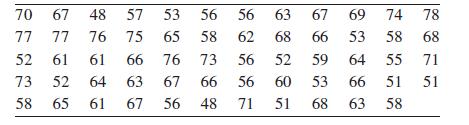
a. Construct a stem-and-leaf plot, using the digits 4, 5, 6, and 7 as the stems.
b. Repeat part (a), but split the stems, using two lines for each stem.
c. Which stem-and-leaf plot do you think is more appropriate for these data, the one in part
(a) or the one in part (b)? Why?
Step by Step Answer:

This question has not been answered yet.
You can Ask your question!
Related Book For 

Question Posted:
