

The following table presents the speed (in mph) and the stopping distance (in feet) for a sample
Question:
The following table presents the speed (in mph) and the stopping distance (in feet) for a sample of cars.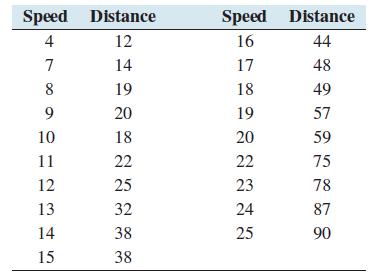
a. Compute the least-squares regression line for predicting stopping distance (y) from speed (x).
b. Construct a residual plot. Explain why the least-squares line is not an appropriate summary of the data.
c. For each data point, square the speed. This is x2. Compute the least-squares regression line for predicting distance y from x2.
d. Construct a residual plot. Is this line an appropriate summary?
e. Use the equation computed in part
(c) to predict the stopping distance for a car whose speed is 15 mph.
Step by Step Answer:

This question has not been answered yet.
You can Ask your question!
Related Book For 

Question Posted:
