

The following table presents the temperature, in degrees Fahrenheit, and barometric pressure, in inches of mercury, on
Question:
The following table presents the temperature, in degrees Fahrenheit, and barometric pressure, in inches of mercury, on August 15 at 12 noon in Macon, Georgia, over a nine-year period.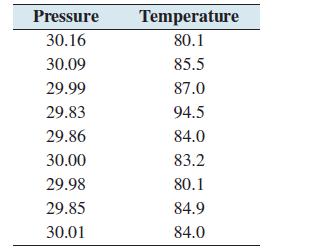
a. Compute the least-squares regression line for predicting temperature from barometric pressure.
b. Compute the coefficient of determination.
c. Construct a scatterplot of the temperature (y) versus the barometric pressure (x).
d. Which point is an outlier?
e. Remove the outlier and compute the least-squares regression line for predicting temperature from barometric pressure.
f. Is the outlier influential? Explain.
g. Compute the coefficient of determination for the data set with the outlier removed. Is the proportion of variation explained by the least-squares regression line greater, less, or about the same without the outlier? Explain.
Step by Step Answer:


