

The following table presents the U.S. imports and exports (in billions of dollars) for each of 29
Question:
The following table presents the U.S. imports and exports (in billions of dollars) for each of 29 months.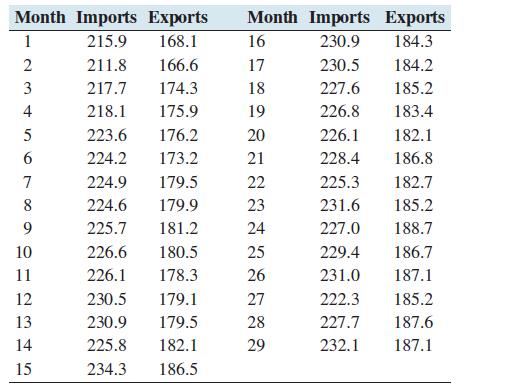
a. Compute the least-squares regression line for predicting exports (y) from imports (x).
b. Compute the coefficient of determination.
c. The months with the two lowest exports are months 1 and 2, when the exports were 168.1 and 166.6, respectively.
Remove these points and compute the least-squares regression line. Is the result noticeably different?
d. Compute the coefficient of determination for the data set with months 1 and 2 removed.
e. Two economists decide to study the relationship between imports and exports. One uses data from months 1 through 29 and the other uses data from months 3 through 29.
For which data set will the proportion of variance explained by the least-squares regression line be greater?
Step by Step Answer:


