

The following tables present the numbers of viewers, in millions for the top 15 prime-time shows for
Question:
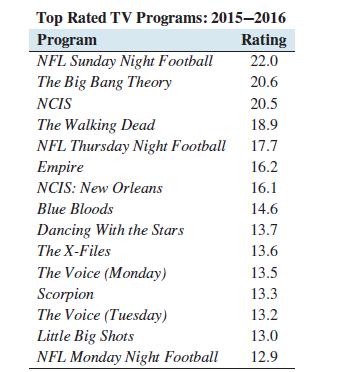
The following tables present the numbers of viewers, in millions for the top 15 prime-time shows for the 2012–2013 and 2015–2016 seasons. The numbers of viewers include those who watched the program on any platform, including time-shifting up to seven days after the original telecast.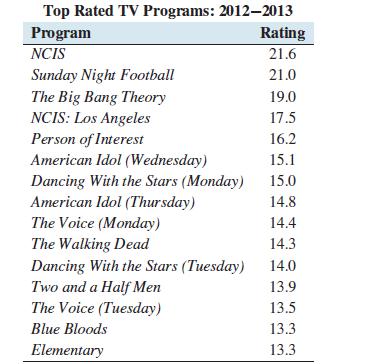
a. Find the population standard deviation of the ratings for 2012–2013.
b. Find the population standard deviation of the ratings for 2015–2016.
c. Compute the range for the ratings for both seasons.
d. Based on the standard deviations, did the spread in ratings increase or decrease over the two seasons?
e. Based on the ranges, did the spread in ratings increase or decrease over the two seasons?
Fantastic news! We've Found the answer you've been seeking!
Step by Step Answer:

Answered By
Isaiah Mutinda
As a graduate with Bs in Maths and Computer Science and having worked as a freelance full stack software developer for 3 years running I believe I have what it takes to conformable tutor and mentor a student to a professional developer also.
2+ Reviews
10+ Question Solved
Related Book For 

Question Posted:
