

The following time-series plot presents the average number of three-point shots made in a National Basketball Association
Question:
The following time-series plot presents the average number of three-point shots made in a National Basketball Association game for seasons ending in 1980 through 2016.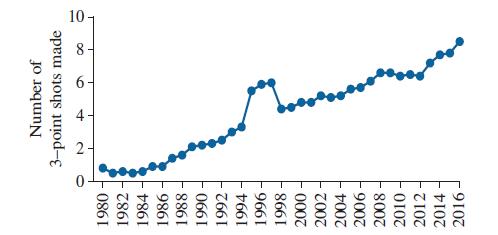
a. In 1997 the average number of three-point shots per game was greater than 6 for the first time. What was the next year that it was greater than six?
b. True or false: Since the year 2000, the average number of three-point shots made per game has increased every year.
c. In 1995 the distance from the three point line to the basket was reduced from 23 feet nine inches to 22 feet. In 1998 the distance was restored to 23 feet nine inches. What was the effect of these rule changes?
Step by Step Answer:

This question has not been answered yet.
You can Ask your question!
Related Book For 

Question Posted:
