

The st graph for a train has been experimentally determined. From the data, construct the vt and
Question:
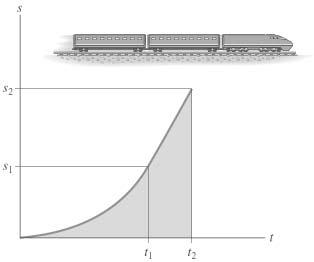
The s–t graph for a train has been experimentally determined. From the data, construct the v–t and a–t graphs for the motion; 0 ≤ t ≤ t2. For 0 ≤ t ≤ t1, the curve is a parabola, and then it becomes straight for t ≥ t1. Given: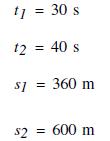
Fantastic news! We've Found the answer you've been seeking!
Step by Step Answer:
k1 5 Velocity ms T1 0001t1t1 30 Splt k1 Sp2t Sp1 11 ...View the full answer

Answered By
Michael Owens
I am a competent Software Engineer with sufficient experience in web applications development using the following programming languages:-
HTML5, CSS3, PHP, JAVASCRIPT, TYPESCRIPT AND SQL.
1+ Reviews
10+ Question Solved
Related Book For 
Question Posted:
