

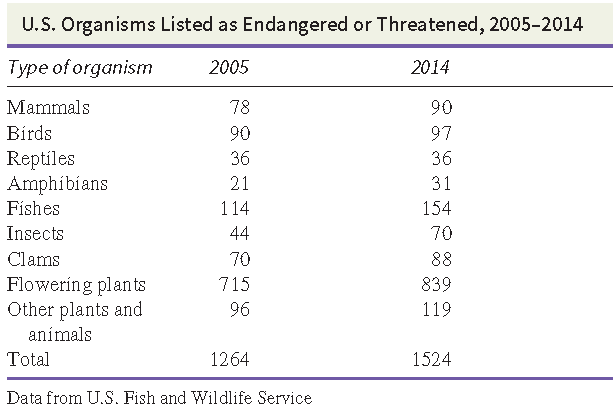
Review the following table and calculate the percent of change in number of U.S. threatened or endangered
Question:
Fantastic news! We've Found the answer you've been seeking!
Step by Step Answer:
2005 2014 Difference Percent of Change Mammals 78 90 1...View the full answer

Answered By
Pushpinder Singh
Currently, I am PhD scholar with Indian Statistical problem, working in applied statistics and real life data problems. I have done several projects in Statistics especially Time Series data analysis, Regression Techniques.
I am Master in Statistics from Indian Institute of Technology, Kanpur.
I have been teaching students for various University entrance exams and passing grades in Graduation and Post-Graduation.I have expertise in solving problems in Statistics for more than 2 years now.I am a subject expert in Statistics with Assignmentpedia.com.
3+ Reviews
10+ Question Solved
Related Book For 

Environment
ISBN: 978-1118875827
9th edition
Authors: Peter H. Raven, David M. Hassenzahl, Mary Catherine Hager, Nancy Y. Gift, Linda R. Berg
Question Posted:
