

Refer back to Figure 5.3. Let t k now represent, not effluent tax, but subsidies. In other
Question:
Refer back to Figure 5.3. Let tk now represent, not effluent tax, but subsidies. In other words, the firm will be paid by the regulators t, (i.e., $20) for each unit of waste cleaned up.
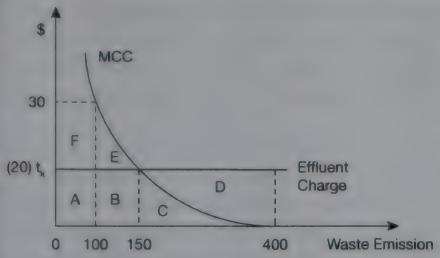
(a) Demonstrate that the final outcome will be the same (cleanup 250 units of waste or control 150 units of waste) regardless whether the firm is charged tax or paid a subsidy.
(b) If the firm is paid a subsidy, it stands to earn a net gain of area D in Figure 5.3, and the government loss will be area A +B in terms of tax receipt.
(c) If the above outcomes are true, what does it suggest about a ‘cost-effective’ outcome of pollution control in terms of income distribution and fairness?
Fantastic news! We've Found the answer you've been seeking!
Step by Step Answer:

Answered By
Utsab mitra
I have the expertise to deliver these subjects to college and higher-level students. The services would involve only solving assignments, homework help, and others.
I have experience in delivering these subjects for the last 6 years on a freelancing basis in different companies around the globe. I am CMA certified and CGMA UK. I have professional experience of 18 years in the industry involved in the manufacturing company and IT implementation experience of over 12 years.
I have delivered this help to students effortlessly, which is essential to give the students a good grade in their studies.
2+ Reviews
10+ Question Solved
Related Book For 
Principles Of Environmental Economics And Sustainability
ISBN: 9780415676915
3rd Edition
Authors: Ahmed Hussen
Question Posted:
